


The BEST and WORST of July
The Mets were hottest in July in 1985 and cold as ice in 1963. How did they fare in franchise history?

2022: 17-8 (.680)
2021: 14-13
2020: 3-5
2019: 14-8
2018: 12-12
2017: 11-13
2016: 13-13
2015: 13-12
2014: 15-10
2013: 15-12
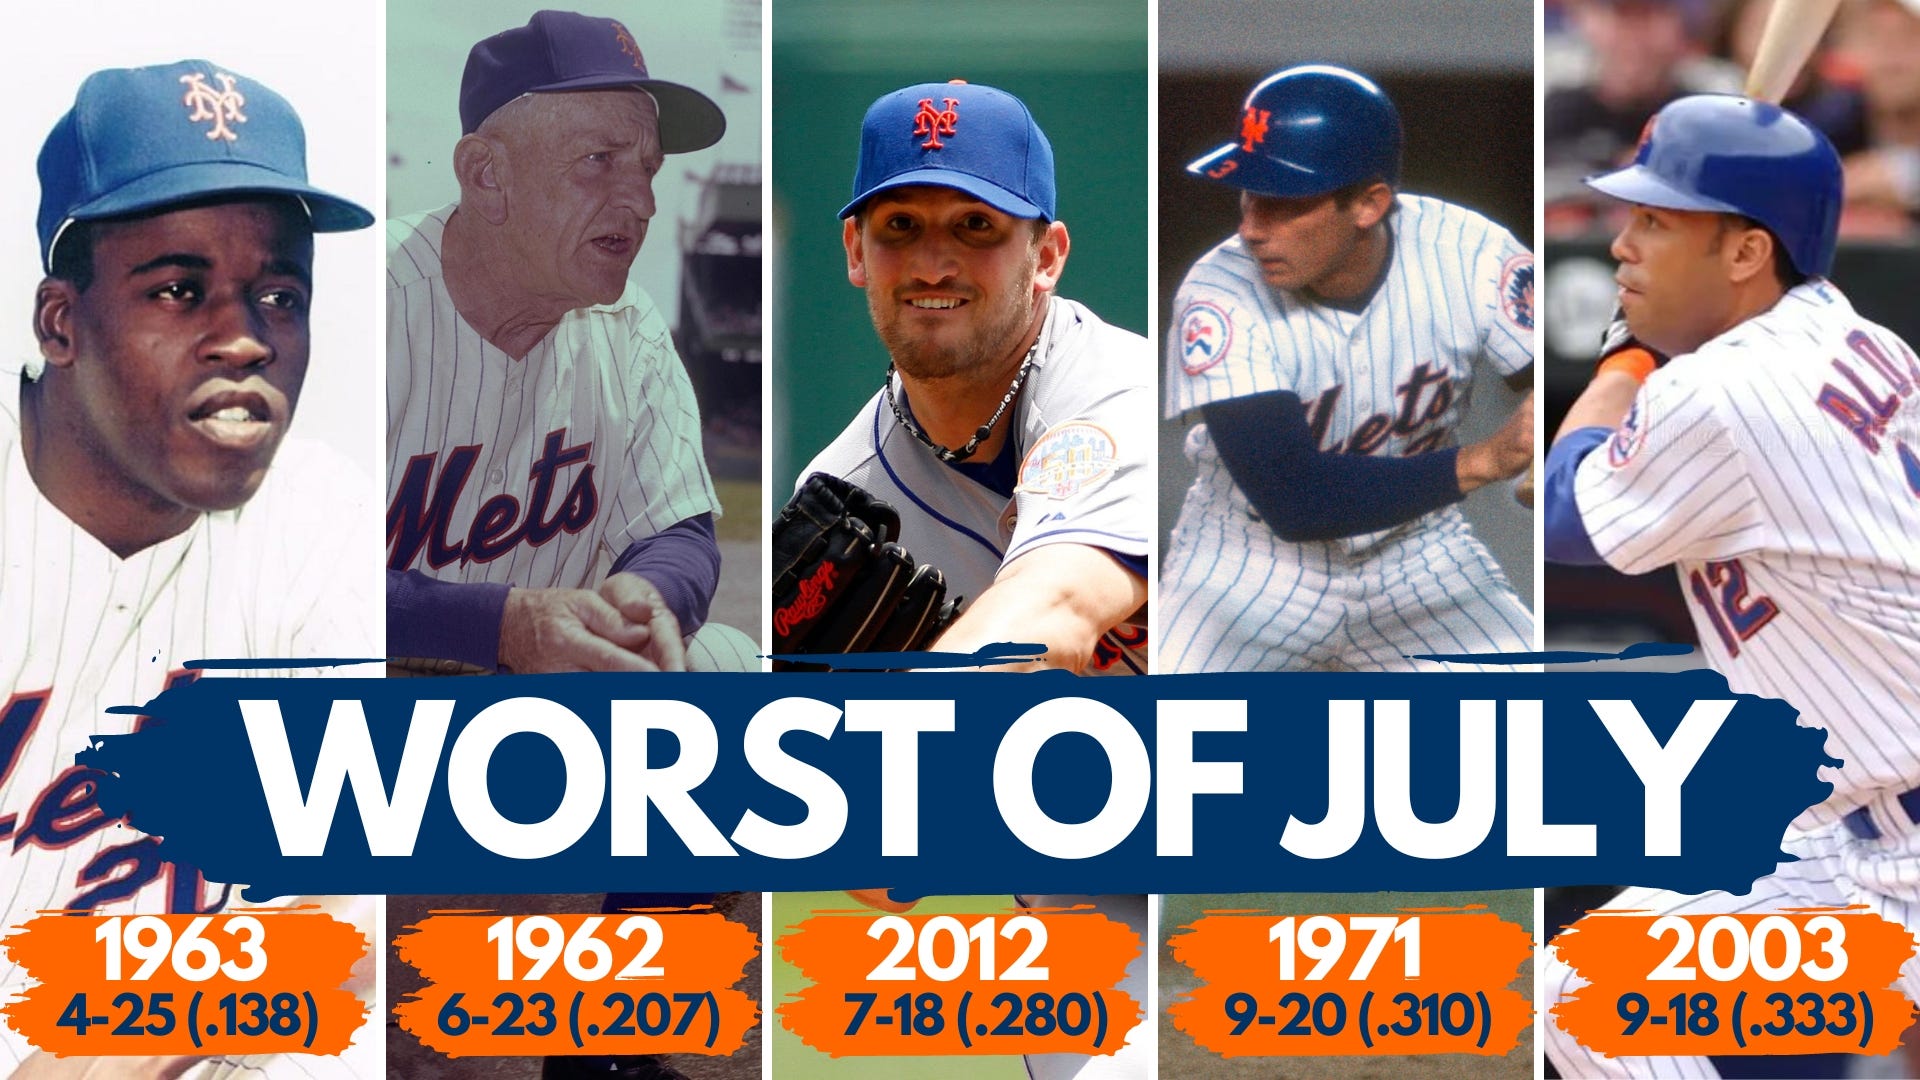
2012: 7-18 (.280)
2011: 14-13
2010: 9-17
2009: 12-14
2008: 18-8 (.692)
2007: 13-14
2006: 16-9
2005: 14-13
2004: 12-15
2003: 9-18 (.333)
2002: 15-11
2001: 14-11
2000: 14-13
1999: 18-9 (.667)
1998: 13-15
1997: 15-11
1996: 15-11
1995: 12-15
1994: 16-10
1993: 12-16
1992: 13-11
1991: 16-11
1990: 17-11
1989: 13-15
1988: 14-12
1987: 16-11
1986: 16-11
1985: 21-7 (.750)
1984: 21-9 (.700)
1983: 10-19
1982: 9-17
1981: ----
1980: 14-14
1979: 13-17
1978: 12-17
1977: 12-16
1976: 13-15
1975: 17-14
1974: 15-12
1973: 12-18
1972: 11-15
1971: 9-20 (.310)
1970: 15-13
1969: 15-12
1968: 13-20
1967: 14-17
1966: 18-14
1965: 8-20
1964: 10-18
1963: 4-25 (.138)
1962: 6-23 (.207)
Keep reading with a 7-day free trial
Subscribe to @MetsRewind to keep reading this post and get 7 days of free access to the full post archives.